In traditional systems, a 200 OK means success, but in agentic AI a 200 OK can still mean a completely wrong answer.
So, only monitoring response status, output, and metrics is not enough to track failures in real-world Agentic AI systems.
We need more than that. In this article, we will understand the real-world Agentic AI failure points and how to handle them to avoid production downtime.
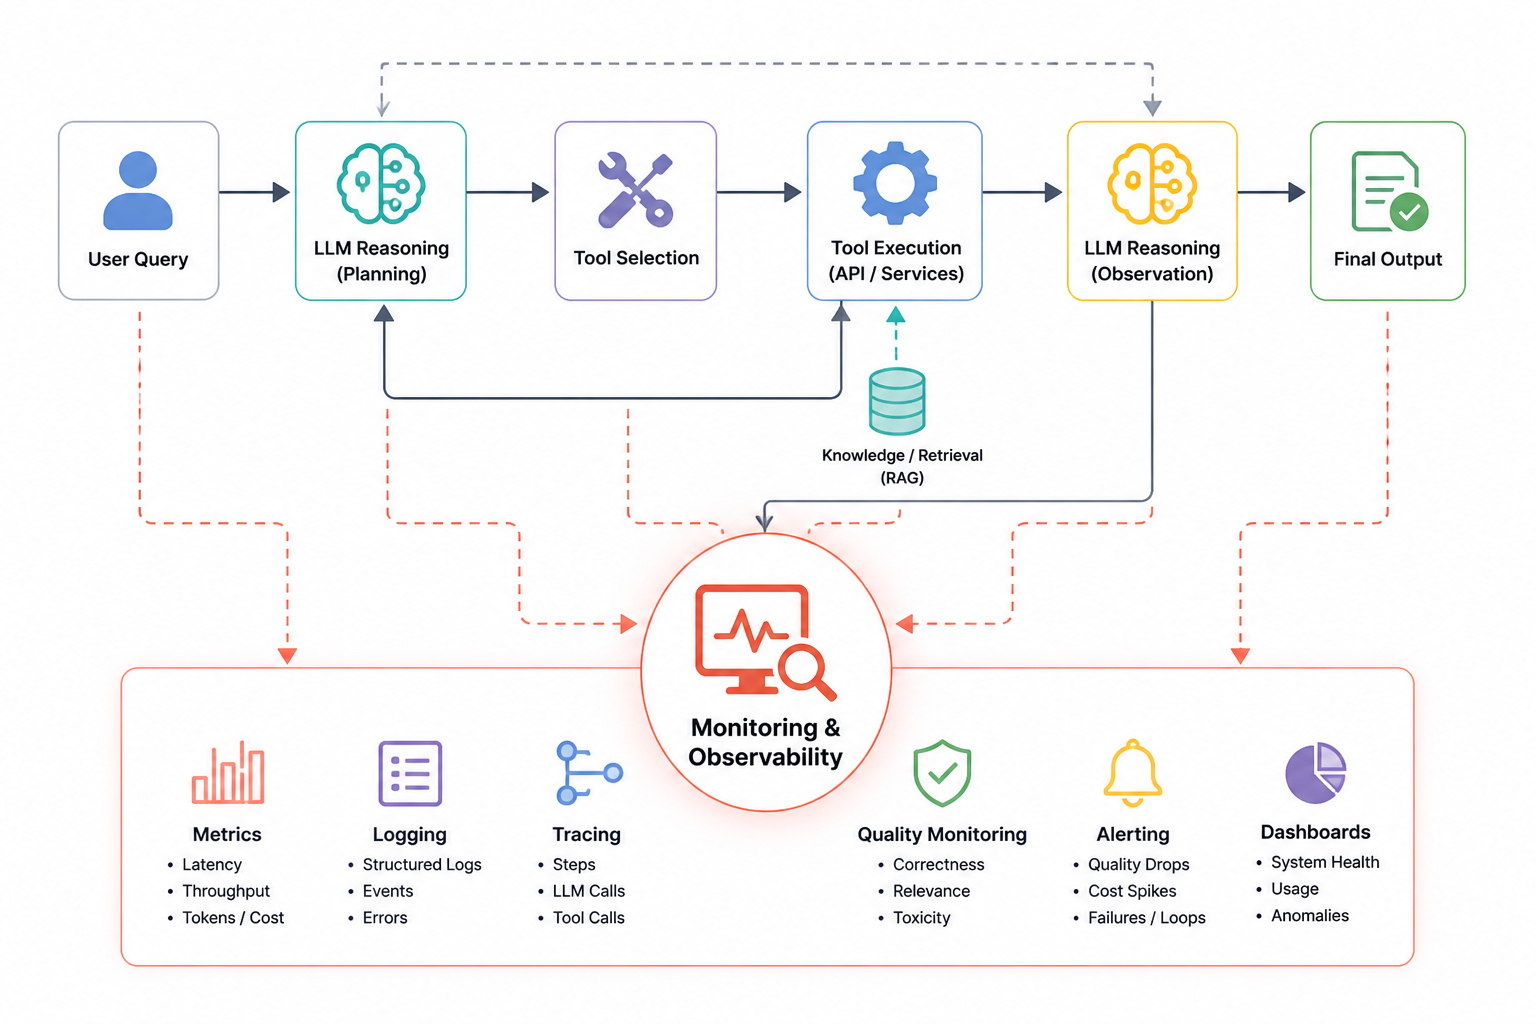
High-Level Agentic AI Connected Components
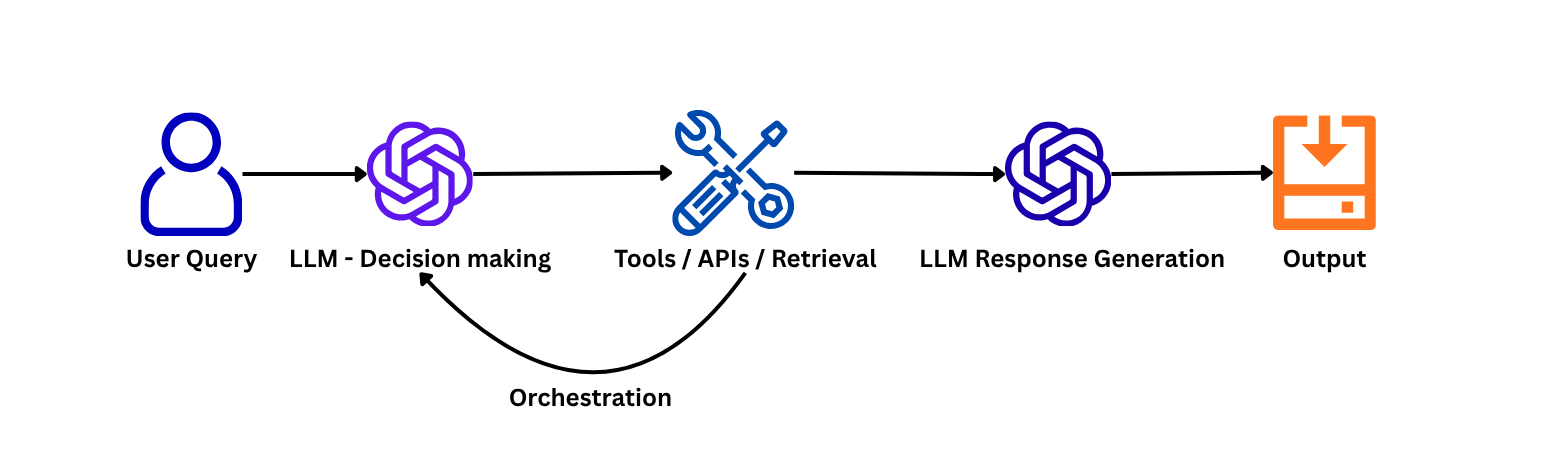
This is a typical Agentic AI pipeline where the LLM reasons based on the query passed by the user and then acts upon that decision using the right tools. If required, the tool output goes back to the LLM for further reasoning; otherwise, it generates the final output.
For example: Suppose we have an agent that takes the last 100 emails using the Gmail API and then tags each of them as promotional or non-promotional and saves them to Excel. Here, we have two actions: (1) fetch the last 100 emails using an API call, and (2) save the output to Excel using another API.
In short, we have too many layers in an Agentic AI pipeline, so monitoring at every level is important such that if a logical mistake happens via LLM reasoning, we should know at what stage this failure occurred.
Failure Points in Production
Input Data (Garbage In)
In RAG, this can happen at the retrieval stage, but in Agentic AI pipelines, this error can occur if we get an unexpected input format or long queries. This can cause a significant increase in incorrect outputs.
What to monitor?
- Input length distribution
- Input anomaly detection
- Injection patterns
Example: If a query starts with “Ignore previous instructions...”, then it is a red flag.
LLM-Level Failures (Core Brain Issues)
At the LLM level, we can see failures such as excessive hallucinations, inconsistent answers, etc. These are more serious failures that we need to monitor; otherwise, an increase in these can lead to wrong answers with high confidence. In real-world systems, if you see incorrect outputs delivered with high confidence leading to wrong decisions, the cause can be inconsistency or hallucination.
What to monitor?
-
We can add another layer of an LLM to track inconsistency—something like a critic agent that assesses the output of the previous agent and calculates a consistency score.
Consistency means: same or similar inputs should produce semantically similar outputs - Ground truth metrics to test drift in output using metrics like precision@5, recall@5, MRR@5, etc.
Tool / API Failures (Very Common)
If the pipeline starts giving incorrect answers, or if there is an increase in response time, then these kinds of failures generally happen due to tool failures. Wrong tool selection, tools becoming slow due to too many calls, etc., are common failure types at this layer.
What to monitor?
- Tool call success rate
- Tool latency
- Tool selection accuracy—this can happen due to incorrect or incomplete metadata about the tool in the tool registry
Agent Reasoning Failures (Hardest to Debug)
Infinite loops, wrong reasoning paths, or over-calling tools are the types of failures we see at this stage. This can cause high costs, latency spikes, or unusual multi-step traces.
What to monitor?
- Number of steps per request
- Repeated tool calls
- Loop detection
Retrieval / RAG Failures
Some Agentic pipelines use RAG as a tool to get relevant information for the user query and then resolve it using the fetched information. Here, wrong document retrieval and missing context are some of the types of failures that can lead to incorrect and irrelevant output.
What to monitor?
- Retriever relevance score
- Document usage stats
- Top-k similarity distribution
Cost Failures
Here, failure types occur due to token explosion, recursive agents, etc. This can lead to huge cloud bills and can happen after deployment.
What to monitor?
- Tokens per request
- Cost per user
- Cost anomalies
How We Build Monitoring in Real Systems
In Agentic or RAG pipelines, we have too many moving components, and failures can occur at any stage or layer. Therefore, effective monitoring should account for each and every layer.
Logs tell you what happened, traces tell you where it happened, and metrics tell you when it started going wrong.
Layer 1: Structured Logging
This is the foundation of any monitoring system. We need to build proper structured logging that logs each and every step such that if a failure happens, it is easy to track which component or module led to the system failure.
For example: Every request should log:
{
  "request_id": "abc123",
  "user_input": "...",
  "llm_output": "...",
  "tokens_used": 1200,
  "tools_called": ["email_fetch_api"],
  "latency_ms": 2300
}
Layer 2: Tracing
Instead of one log, we track the full journey to increase step-by-step visibility.
You get traces like this:
- Step 1: Prompt
- Step 2: LLM call
- Step 3: Tool call
- Step 4: Observation
- Step 5: Final answer
Layer 3: Metrics
Metrics are an important thing to consider. We use different metrics discussed above, for example precision@5 or recall@5 to check the accuracy of the retriever, or a critic-based confidence score to track the consistency of the output.
So here we can track:
System metrics
- Latency
- Throughput
- Error rate
AI-specific metrics
- Tokens (input/output)
- Cost per request
- Steps per agent
Layer 4: Semantic Monitoring
This is the layer where real AI observability begins. Here, we measure:
- Relevance
- Accuracy
- Toxicity
- Completeness
In most production systems, this is implemented using an LLM-as-a-judge approach that scores outputs for correctness and relevance. We can also use tools like Helicone to implement this kind of observability.
Layer 5: Alerting
No need to alert on everything blindly. We can set alerts on quality drops, cost spikes, increased tool failures, or loop detection, etc.
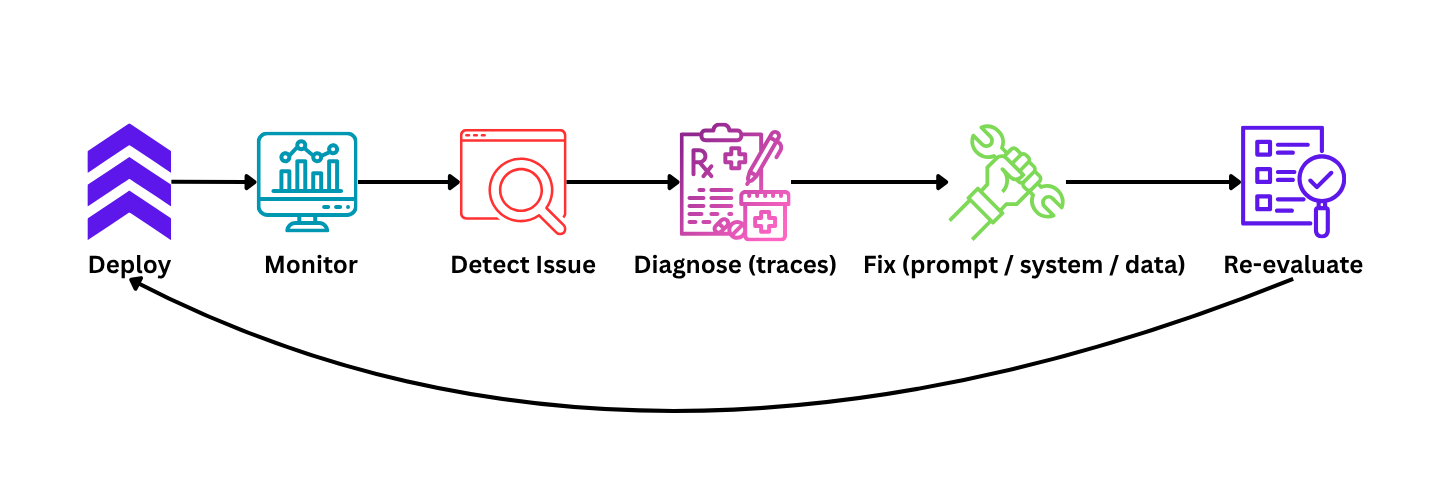
When Do We Need Prompt Tuning?
This is the most important part of monitoring AI pipelines. If the characteristics of input queries change over a period of time, this can lead to incorrect or inconsistent responses. To avoid this problem, we need to fine-tune the prompts we use at the reasoning step or wherever we are using prompts.
So, when exactly is prompt tuning needed:
- If the quality score drops: For example, if an LLM judge or rule-based system indicates that the outputs we are getting from the pipeline are worse, then we need to refine instructions by adding a new set of examples.
- Output inconsistency increases: If the inconsistency score generated by the LLM itself using the pipeline output increases, then we need to fine-tune the prompt. For example, we may need to make instructions more explicit or constrained.
- Hallucinations increase: The LLM generation part starts ignoring the provided context.
- Token usage spikes: This can happen if responses suddenly become longer than usual; we need to add better constraints to the current prompts.
When NOT to do prompt tuning:
- Retrieval failure
- Tool API issue
- Latency
- Data issue
Conclusion
- Agentic AI systems don’t fail like traditional systems—they degrade silently.
- The real challenge is not handling failures, but detecting them before they impact users.
- The teams that succeed are not the ones with perfect models, but the ones with strong observability.
If you want to build an AI system with proper monitoring, contact me at:
LinkedIn: https://www.linkedin.com/in/veer-khot-93177bab/
Website: veerkhot.com
← Back to Articles